excel input files
seniority_list is designed to produce comprehensive datasets reflecting the data model(s) described by the user. The information and the data model description necessary for this process is transmitted to seniority_list through simple spreadsheet workbooks.
While the Microsoft Excel program may be used to produce the workbooks, any spreadsheet program may be used to work with seniority_list as long as it can produce .xlsx files (such as LibreOffice Calc). The reference to “Excel” throughout this user guide refers to .xlsx files, not specifically the Excel program.
There are four Excel files required as inputs for each case study. They are located within an appropriately-named folder, created by the user. There may be many different case study folders within seniority_list ant any one time. The case study folders are located within the excel program folder.
excel/<name_of_case_study>/With our hypothetical case, this would translate to a folder and file as such:
excel/southern_acme/The sections below will walk through each of the four Excel input files and will provide detailed data and formatting requirements for each of them.
Note
The task of formatting input files as described below will be magnitudes simpler if another case study folder is copied into the excel folder, renamed to match the new case study name, and the workbooks therein modified as appropriate.
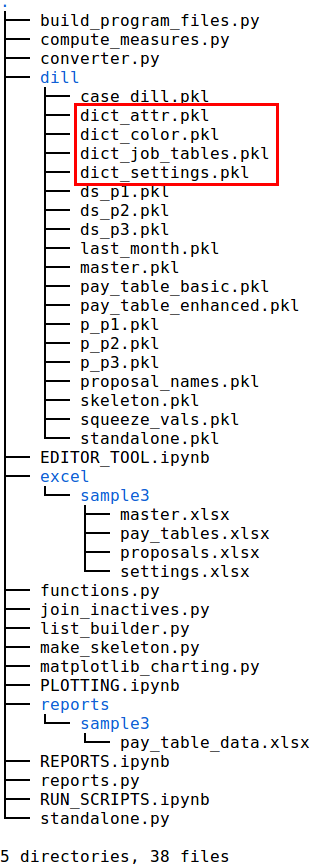
In the following image, the highlighted section within the sample3 folder shows the excel files included with the program for the sample case study. The name of the sample case study included with the seniority_list program is “sample3”. For our theoretical case (“southern_acme”), the user would copy the sample3 folder, paste it back into the excel folder, and rename it “southern_acme”. The user would then open the Excel workbooks in the southern_acme folder and modify the contents of the worksheets as appropriate.
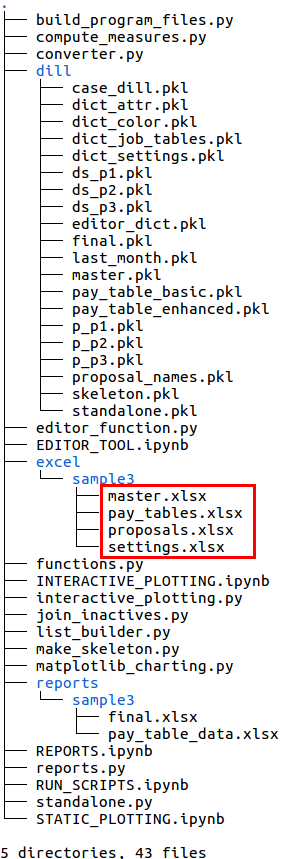
tree view of seniority_list package, with the Excel input files highlighted
Note
All date inputs must be formatted as dates within each spreadsheet input file. Right-click on any cell or group of cells containing dates and select “format cells” or something similar and verify date format. If the date inputs are actually formatted as text even though they look like dates, the program will not be able to generate the files needed to run the program.
master.xlsx
The master.xlsx workbook provides basic employee data to the program:
- Employee data (for each employee)
unique employee key (number)
employee group membership
last name
date of birth
date of hire
longevity date
special group membership
furlough status
work status (active or inactive)
order within employee group
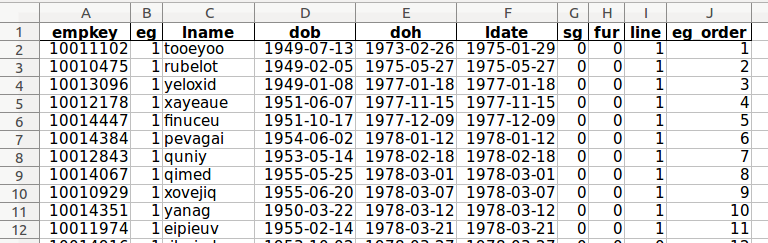
master.xlsx file format example
master.xlsx contains only one worksheet and the name of the worksheet is unimportant.
master.xlsx contains information for the employees of all groups. The physical order of the list is unimportant at this step, as long as the “eg_order” (employee group order, or order within each group) column data value is correct, even if the list is not sorted according to this value.
Note that since there is only one master list stored within the program, any employee data discrepancies which may exist between the master list information supplied by the various parties must be resolved as part of the data preparation phase.
Note
There is a function named compare_dataframes within the list_builder.py script that is especially helpful to clean and discover any discrepancies between the initial separate master data supplied by the employee groups.
master.xlsx format guide
Do not add any additional columns to the worksheet, such as a row count column. Only include the columns shown above and described below, with the exact column names in the first row, in lower case. Columns A, B and G through J should be formatted as numbers (integers), column C as strings (text or general), and columns D through F as dates (format YYYY-MM-DD).
The master.xlsx employee data worksheet must have one row for each employee and columns of attributes for each employee as follows:
empkey (standardized employee number, integer)
- Recommended format:
employee number + (10,000,000 * eg (employee group) number)
#23456 in eg 1 becomes #10023456
#23456 in eg 2 becomes #20023456
- eg (employee group, integer)
Assign the same number (i.e. 1, 2, etc.) in this column to each member of the same group. Always begin with the number one and use sequential numbers for other groups. This format is important for proper operation of other functions within the program.
- lname (last name, string)
lowercase
- dob (date of birth, date format)
Date of birth is used to calculate retirement date using a retirement age input. The program will correctly compensate for leap years.
- doh (date of hire, date format)
Normalized initial class date
- ldate (longevity date, date format)
Date for pay longevity and/or non-furlough time calculations
- sg (special group, integer (1 or 0))
Employees with special job conditions are marked with a 1, others with a 0. If there are no employees with special job conditions, the values for the entire column should be zeros.
- fur (furlough, integer (0 or 1))
Furloughed employees are marked with a 1, all others with a 0. If there are no furloughed employees, the values for the entire column should be zeros.
- line (line, integer (0 or 1))
Line (active) employees. Active employees are marked with a 1, others (sick leave, supervisory, etc.) are marked with a 0. If there are no inactive employees (unlikely), the values for the entire column should be zeros.
- eg_order (employee group order, integer)
A number that represents the correct list order within each employee group, starting with 1 for each employee group. These numbers are independent of a combined list number.
The information within master.xlsx is read by seniority_list and is stored within the dill folder as a pandas dataframe, master.pkl. The dataframe structure matches the worksheet structure with the addition of a calculated retirement date column (“retdate”).
proposals.xlsx
The proposals.xlsx workbook provides the following information to the program:
- Integrated list data (for each proposal)
order by unique employee number (empkey)
proposal names (as set by worksheet names)
example list order, used to order skeleton file
The proposal orderings are derived from the proposed integrated lists supplied by the parties. There is no limit imposed by seniority_list to the number of proposals which may be included on separate worksheets.
Note: seniority_list may process list orderings from other sources (the editor tool and the list_builder.py script). These features are discussed within the user guide.
proposal.xlsx format guide
The proposals.xlsx Excel file is a multi-sheet workbook, with each sheet containing a different list ordering proposal. The names of the worksheets are incorporated into the names of the resultant dataset names and will be the reference when working with the various outcomes for analysis and plotting. Therefore, the names of the worksheets should reflect the proposal therein. With our hypothetical integration study, the worksheets should be named “southern” and “acme” (or a shorter abreviation), reflecting the proposals from each group. The proposal names should be limited to a maximum of 10 characters. Short proposal names are preferred, because these names will be used as inputs to many of the plotting functions.
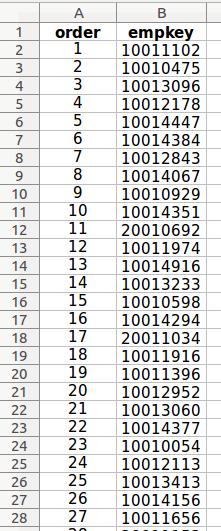
The worksheets must contain at least one column with the header “empkey” (employee number key, exact spelling, lower case) containing the unique empkeys in the proposed order. The “order” column is not technically required for program operation but may be included as a user convenience with no detriment to program operation. The “empkey” column should be formatted as a number (integer), not text.
Each proposal must contain the same list of empkeys (employee numbers), reflecting the active employees as determined by the master.xlsx file “line” column.
pay_tables.xlsx
pay_tables.xlsx provides the following information to the program:
- Compensation
pay rate tables for each basic job level, employee longevity, and contract year category
pay rates for an interim period
number of modeled pay hours per month for each job level, basic and enhanced
- Jobs
basic-to-enhanced job conversion data
job level text descriptions
The program uses the data supplied from the pay_tables.xlsx workbook to create optimized compensation lookup files which are used when the datasets are generated. The data is also used to create a multi-sheet Excel workbook containing computed monthly pay tables and job level hierarchy tables. This workbook, pay_table_data.xlsx, is written to a case study folder within the reports folder. The workbook format permits the computed pay data to be reviewed by the user.
The pay-related files are created when the build_program_files.py script is run.
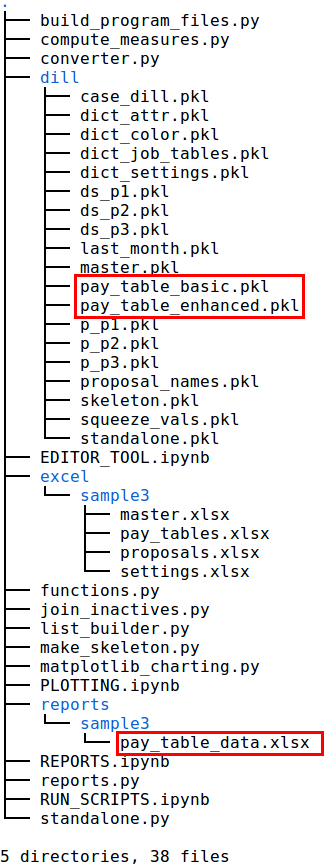
files produced from pay_tables.xlsx data
basic vs. enhanced job levels
seniority_list is designed with the capacity to handle two different job hierarchy methodologies.
The first method is a basic mode which assumes a “stovepipe” or linear movement upwards through the distinct job levels, each of which have a defined compensation rate and a uniform number of monthly pay hours within each job level.
The second method is the “enhanced” mode which offers additional job level layers for the program data model when it is appropriate. This would occur when contractual or other provisions provide for some workers to receive less monthly pay hours than other workers at the same compensation level.
Note
It is not a requirement to incorporate “enhanced” job levels within the model when they do not exist for the industry case or are not desired. In that case, the “enhanced_jobs” value on the “scalars” worksheet within settings.xlsx should be set to “False”.
For example, assume that an industry contract defines five separate job levels, ranging in hourly pay from $20/hour to $100/hour, and assumes each worker will be paid 160 hours/month. In this case, the “basic” mode of job hierarchy is appropriate and completely sufficient to model job and compensation projections.
However, if that industry contract further defines that some workers at each level will work and be paid 120 hours/month, this doubles the number of job levels to be considered in an integration analysis, because each job level contains two categories of monthly pay hours. It also complicates the career progression model, since employees will likely prefer positions based on total compensation amounts, not just hourly rate of pay.
The job hierarchy mode is selected via the “enhanced_jobs” value (True or False) within the settings.xlsx workbook (“scalars” worksheet).
pay_tables.xlsx format guide
The pay_tables.xlsx workbook contains compensation data on two worksheets with specific names, in lower case:
- “rates”
formatted hourly pay rate table for basic job levels including contractual pay changes and longevity increments
- “hours”
small table containing basic and enhanced job level hours per month and descriptive job codes
worksheet tabs within the Excel pay_tables.xlsx workbook
rates
The pay table “rates” worksheet has a straightforward formatting layout. The user must create the the worksheet from contractual pay information. There is one pay data worksheet for each case study.
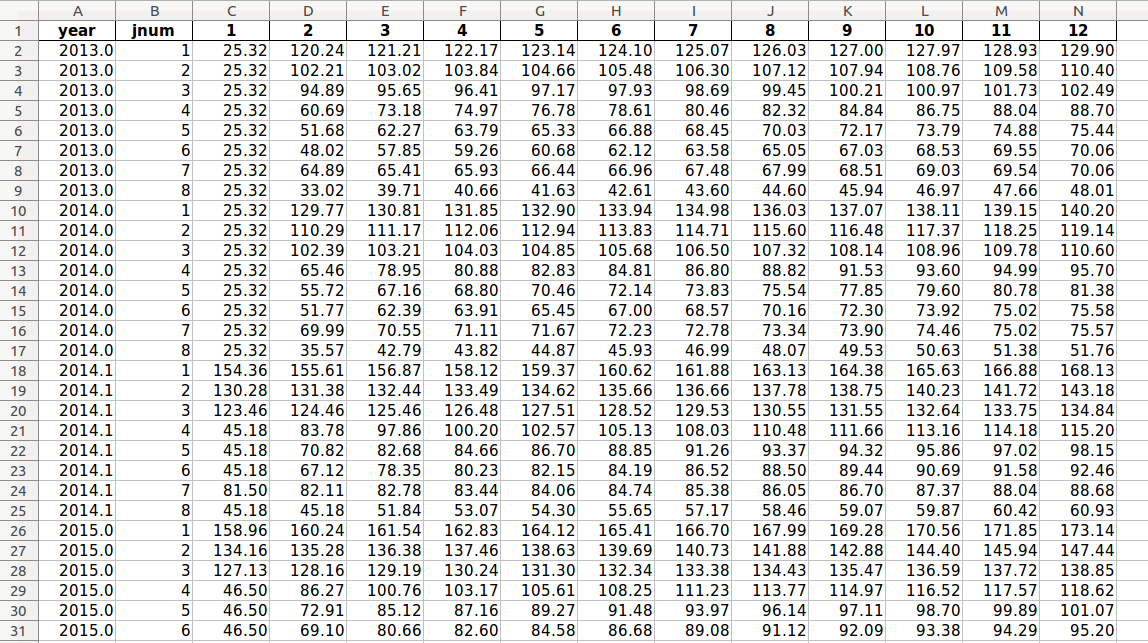
pay_tables.xlsx format example, “rates” worksheet
The worksheet can be thought of as employee pay rate tables for multiple years, stacked together forming one table. Within each contractual year block, the pay rates for the various job levels are positioned vertically from highest to lowest and longevity pay increases are positioned horizontally, lowest to highest.
All columns are formatted as numbers. The header row contains a “year” column and a “jnum” column (both lower case), and other columns with integer headers representing the longevity year pay steps (1 through the top of scale year).
The data in the year column is a float type (decimal number) representation of the applicable contract pay year. The year 2018 would be represented as “2018.0”.
The year column may include one or more exception values (“2014.1” in the image below) which allow for a temporary or interim pay scale(s) if they exists. An interim pay scale might exist for a certain transitional time period such as a partial year at new contract pay rates. A pay exception year value and duration is set using the “pay_exceptions” worksheet in settings.xlsx. Simply adding .1 to the year in which a pay exception occurs will allow for the fastest follow-on indexing calculations which utilize this data.
The data within the “jnum” (job number) column represents the different job levels within the data model. A job level of 1 represents the highest paid position, with subsequent incremental job level numbers representing job levels with decreasing compensation rates. The program will automatically insert an additional job level after the lowest job level to represent employees who are furloughed (or who could become furloughed in various modeling scenarios) when the Excel file is read. A model with 8 active job levels will be modified to have job numbers 1-9 in the “jnum” column for each contract year in the “year” column, with job number 9 representing furlough with no pay. This can be reviewed by examining the pay_table_data.xlsx file within the reports folder after running the build_program_files.py script.
The year longevity columns (integers) hold the hourly compensation data for employees with various levels of service with the enterprises. Column 1 would be the rates for employees working in their 1st year of service, column 5 would contain the rates for employees working in their 5th year, etc. up to the maximum longevity scale. Employees with more years than the maximum longevity scale are capped at the maximum longevity rates.
Note that the year column has repeating row values for each of the job levels. Also, the pay exception built into this pay table is evident with all the rows with 2014.1 in the “year” column. The user may directly examine the Excel files included with the program for further clarity (excel/sample3/pay_tables.xlsx).
hours
This worksheet supplies the program data model with the number of monthly pay hours applicable to each job level. In other words, by inputing data into this table, the user sets the average number of pay hours to be allocated within each job level, for both the basic (no full- and part-time pay within job levels considered) and the enhanced (including full- and part-time jobs within job categories) job data model options.
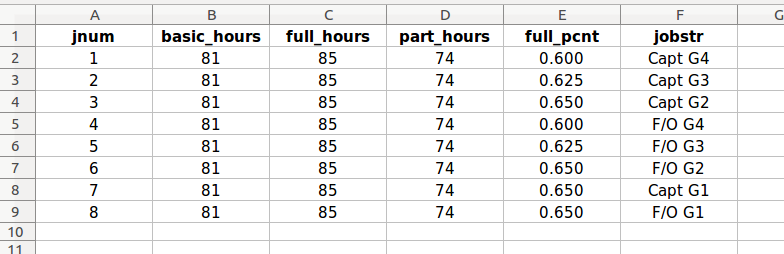
pay_tables.xlsx format example, “hours” worksheet
The “jobstr” column (“job string”) is used by the program to provide a short job level description in text form for various chart legends and titles. If an enhanced model is selected, designated full- and part-time suffixes will be added to the enhanced job descriptions appropriately. The suffixes are specified by the user through the “enhanced_job_part_suffix” and “enhanced_jobs_full_suffix” values provided through the “scalars” worksheet within the settings.xlsx workbook. The enhanced job strings may be viewed on the “enhanced ordered” worksheet within the pay_table_data.xlsx file within the reports/<case study> folder after the program files have been constructed.
The “jnum” column (job number) contains the integer code value for each non-furlough basic job level within the data model, in sequential order. These job numbers correspond to the job numbers in the “jnum” column in the “rates” worksheet.
The “basic_hours” column contains a user-specified number of monthly pay hours for each job level. The number of pay hours may vary for different job levels. Calculated values derived from this column are utilized by the program when the user specifies a basic, non-enhanced data model, by setting the “enhanced_jobs” option to “FALSE” on the “scalars” worksheet within the settings.xlsx workbook.
The “full_hours”, “part_hours”, and “full_pcnt” columns contain data pertaining to enhanced job models. As in the “basic_hours” column, the values in each of these columns may vary from job to job, as required.
full_hours - the number of monthly hours within a job level for “full-time” employees
part_hours - the number of monthly hours within a job level for “part-time” employees
full_pcnt - the percentage of all jobs within a job level to be allocated as “full-time”. The remaining percentage of jobs will be allocated as “part-time”.
Even if a basic data model is selected by the user, the above columns must remain in place to prevent a calculation error, though the enhanced job model inputs will not be used for further program analysis.
job level hierarchy
seniority_list uses a job-level hierarchy based on compensation. This hierarchy determines the order of job assignments and employee compensation throughout the entire data model.
A basic or non-enhanced data model assumes that the proper value order of job levels is as supplied by the user through the pay_tables.xlsx input workbook, with job level 1 the best-paying and most desirable, and therefore, most “senior” job level.
However, it is possible that some job level(s) may compensate workers proportionally more or less in certain pay-scale longevity years as compared to other job levels. This means that independent sorts of job level compensation for all contract years and/or longevity steps could show slightly different orderings when the underlying job level pay rates vary enough over contract years or, more likely, contract longevity steps.
When an enhanced model is used, additional discrepancies in compensation sorts may be introduced, when the issue above is combined with the more numerous enhanced job levels.
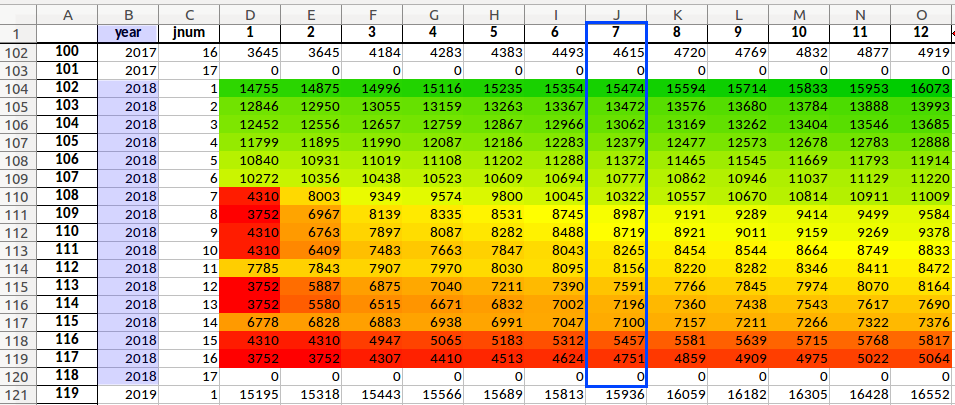
uneven enhanced job level sort (highlighted with color conditional formatting for clarity), primarily job levels 11 and 14 for longevity steps 1 through 6, within contract year 2018. In this case, the chosen sort index is contract year 2018, longevity step 7 (outlined).
Because of this possibility it is recommended that the user carefully examine the “basic_ordered” and “enhanced_ordered” worksheets within the pay_table_data.xlsx workbook, located within reports folder. This workbook is automatically generated by seniority_list when the build_program_files script is run. These worksheets display the job level hierarchy created by the program, according to a compensation sort for a particular contract year scale and contract longevity step. These values are set and adjusted by the user through the “pay_table_year_sort” and “pay_table_longevity_sort” value inputs in the “scalars” worksheet within the settings.xlsx input excel file. A contract year and longevity step should be selected which provides the best overall compensation sorts for the life of the model as indicated by the information in the pay_table_data.xlsx each time new program files are generated.
The job level sorting algorithm will ensure that the order of jobs will be the same in all contract years and longevity steps throughout the data model. If the user wishes to adjust the pay level sort indexing, the settings.xlsx workbook must be saved after inserting the new values and the build_program_files script must be rerun. The results of this procedure will include replacing the pay_table_data.xlsx file with a new file containing the updated results.
Job compensation sort variation will not exist in all case studies, and in fact is likely to be an unusual situation. When it does exist, seniority_list provides a method to minimize its effect by allowing users to chose a pay sorting index point. This offers the best overall solution to construct a consistent job level hierarchy, while controlling (usually minor) uneven job level compensation rates uniformly for all of the employee groups.
settings.xlsx
settings.xlsx provides the following information to the program:
- Jobs
job counts
job count changes schedule
- Compensation
annual compensation increase or reduction after contract expiration
contract top of scale longevity (years)
pay raise option on/off
pay raise percentage
pay scale exception year code(s) and duration(s)
pay scale exception start/end dates
compute pay measures on/off
pay table year and longevity for job level hierarchy sort
- Furlough
recall schedule
- Descriptions
employee group number to text descriptions for stats/charting output
jobs to text descriptions for stats/charting output
some of the color lists for visualization
dataset attribute descriptions
- Job Assignment Special Conditions
schedule
jobs affected
other supporting data
- Dates
starting date
delayed implementation date
- Special Conditions
pre-existing job rights
ratio job assignment
ratio count-capped job assignment
minimum count job assignment
- Retirement Age
retirement age increase on/off
retirement age increase dates and age increase
- Merger-specific Information
abbreviations, proposal names, job descriptions, chart colors
label dictionaries
- Integration Delay
delayed implementation (on/off)
- Jobs
compute results using job change information vs a static number of jobs (on/off)
number of job levels (enhanced/basic)
- Furlough
compute incorporating recall (on/off)
ignore time furloughed for longevity calculation (on/off)
include furloughed employees when calculating certain list percentages (on/off)
- Calculation Type
no bump-no flush on/off
actives_only on/off
lspcnt calculation on/off
columns to include in the dataset
compute cat_order (global job category rank) on/off
- File Storage
save_to_pickle on/off
The settings.xlsx workbook contains many worksheets and is the source for the four dictionaries which seniority_list uses to produce datasets and build chart displays, with the exception of much of the color dictionary which is generated internally from the matplotlib colormap collection.
The attribute, color, and settings dictionary files
settings.xlsx format guide
The settings.xlsx workbook contains multiple worksheets with various formatting requirements. This section describes those requirements and is applicable to any case study.
The settings.xlsx file is customized by manually updating worksheet cell values and possibly adding or deleting certain rows/columns as appropriate for each case study.
It is important to not change the structure of the worksheets or the “headers” (first row column names) in each worksheet except as described below. Many of the Python routines are looking for a specific layout to be able to gather and process the data correctly.
Except for the “scalars” and “attribute_dict” worksheets (the first two), the definitions below refer to columns in each sheet.
All dates used in seniority_list to designate a calendar month or starting and ending dates are end-of-month dates. “2015-12-31” is ok, “2015-01-01” will fail.
The screenshots below walk through each worksheet of the sample (“sample3”) case-specific settings.xlsx file. The displayed values in the screenshots are from the sample case study which must be changed to the appropriate values for each actual case study, using the guidance below.
The 14 worksheets within the settings.xlsx workbook:
1. scalars2. attribute_dict3. ret_incr4. pay_exceptions5. job_counts6. job_changes7. recall8. prex9. ratio_cond10. ratio_count_capped_cond11. proposal_dictionary12. eg_colors13. basic_job_colors14. enhanced_job_colors
scalars
The “scalars” worksheet contains a column of options and a column of corresponding values. The items in the value column are set by the user as appropriate/desired. The items in the option column should not be changed - the program looks for these specific phrases when it operates.

Program options are set on this sheet along with many other single value variables.
GENERAL
enhanced_jobs : boolean
True - use enhanced job levels modelFalse - use basic job levels modeljob_levels_basic : integer
The number of job levels in the model without any enhancement for full- or part-time stratification. Include jobs that are found in any employee group even if those jobs are not found in all employee groups.
job_levels_enhanced : integer
Total count of part- and full-time job levels. Normally double the number of basic levels.
enhanced_jobs_full_suffix : string
The suffix to append to full-time job level descriptions, for print-out within the pay_table_data.xlsx report, stored within the case-specific folder in the reports folder.
enhanced_jobs_part_suffix : string
The suffix to append to part-time job level descriptions, for print-out within the pay_table_data.xlsx report, stored within the case-specific folder in the reports folder.
compute_with_job_changes : boolean
True - use job count changes in modelFalse - assume static or constant job counts for modelno_bump : boolean
True - compute data model utilizing the no-bump, no-flush systemFalse - allow full flush and bump for job assignmentrecall : boolean
True - include recall of furloughed employees within data modelFalse - inhibit recalldiscount_longev_for_fur : boolean
True - do not apply furlough time towards longevity timeFalse - allow furlough time to be included as longevity timelspcnt_calc_on_remaining_population : boolean
True - include furloughed employees and employees remaining each month within denominator for list percentage (lspcnt) calculationsFalse - include furloughed employees and the greater of employees remaining or jobs available each month within denominator for list percentage (lspcnt) calculationsstarting_date : date string
The effective data of the merger. This date is different than the implementation date. The effective date is the date when participating employees and the corresponding list data is frozen for modeling purposes.
delayed_implementation : boolean
True - permit independent operation of the employee group seniority lists until the implementation date to be included within the integrated datasetFalse - calculate dataset with an integrated seniority list commencing on the starting_dateimplementation_date : date string
The anticipated date when the separate employee seniority lists will be integrated into one list. seniority_list will model each group separately until this date.
integrated_counts_preimp : boolean
True - Assign integrated job counts prior to implementation date when calculating integrated dataset.False - Use separate employee group job counts prior to the implementation date when calculating integrated dataset.COMPENSATION DATA
compute_pay_measures : boolean
True - compute and include compensation-related metrics within the calculated dataset(s). The dataset will include the following columns:['mlong', 'ylong', 'scale', 'mpay', 'cpay']False - do not compute compensation-related metrics. This will cut down on dataset computation time when pay-related columns are not needed.future_raise : boolean
Set to True if the model will incorporate an assumed raise at the end of the current contract.
annual_pcnt_raise : float
Assumed annual increase (or decrease) in pay rates if the future_raise input is True. A two percent annual increase would be set as .02
top_of_scale : integer
The number of longevity pay levels. The model assumes the same pay rates for all groups, before and after the implementation date.
INDEXED PAY TABLE
pay_table_year_sort : float
The calendar year within the pay table to use for the model job level hierarchy sort. The year 2018 would be represented as 2018.0
pay_table_longevity_sort : integer
The longevity year within the pay table to use for the model job level hierarchy sort (used in combination with the pay_table_year_sort input).
RETIREMENT
init_ret_age_years : integer
Initial retirement age in years. This is described as initial, because the retirement age may be increased in a future year(s) within the data model.
init_ret_age_months : integer
If the init_ret_age_years input above is not an even year value, use this input to add the number of months needed to represent the correct retirement age. A retirement age of 65.5 would mean that this input should be 6, to represent 6 months. Set at zero if the retirement age is an even year.
ret_age_increase : boolean
Set to True if the model will incorporate an increase in retirement age. If False, the ret_incr variable below will be ignored.
BASIC TO ENHANCED CONVERSION
dist_sg : string
If the enhanced_jobs option value is True, meaning a data model containing enhanced job levels has been selected, this input will determine how basic job level counts are converted and distributed to enhanced job levels.
For example, if enhanced job levels 3 and 5 are the full- and part-time jobs associated with basic level 2, the user may direct that all of the jobs from level 2 be assigned to job 3 (full-time), to job 5 (part-time), or divided between the two according to the percentages specified within the job dictionary (jd variable).
The possible value inputs are:
['full', 'part', 'split']The dist_sg (distribution to special group) input controls the distribution of job counts from basic job levels affected by pre-existing job rights to the corresponding enhanced job level counts.
dist_ratio : string
Same as above, but controlling the ratio_cond enhanced job count conversion/distribution.
dist_count : string
Same as above, but controlling the ratio_count_capped_cond enhanced job count conversion/distribution.
OPTIONAL DATASET COLUMNS (default is True for all, some functions may not operate without some of these columns existing within the calculated dataset(s))
compute_job_category_order : boolean
True - generate a “cat_order” job rank metricFalse - omit the “cat_order” job rank metricadd_eg_col : boolean
True - Add an “eg” column to the dataset containing an employee group code for each employee for every month (integer)False - Do not include an “eg” column within the calculated dataset.add_retdate_col : boolean
True - Add a “retdate” column to the dataset containing employee retirement datesFalse - Do not include a “retdate” column within the calculated dataset.add_doh_col : boolean
True - Add a “doh” column to the dataset containing employee date of hireFalse - Do not include a “doh” column within the calculated dataset.add_ldate_col : boolean
True - Add an “ldate” column to the dataset containing employee longevity dateFalse - Do not include an “ldate” column within the calculated dataset.add_lname_col : boolean
True - Add an “lname” column to the dataset containing employee last nameFalse - Do not include an “lname” column within the calculated dataset.add_line_col : boolean
True - Add a “line” column to the dataset indicating employee active status (1 is active, 0 is inactive)False - Do not include a “line” column within the calculated dataset.add_sg_col : boolean
True - Add a “sg” column to the dataset indicating employees with special pre-existing job rights (“special group”, marked with a 1 vs 0)False - Do not include a “sg” column within the calculated dataset.add_ret_mark : boolean
True - Add a “ret_mark” column to the dataset and mark an employee’s retirement month with a 1. This was developed to be used when the retirement age changes within the model, but may be used as a final month flag as a convenience.False - Skip the “ret_mark” columnsave_to_pickle : boolean
True - save calculated program datasets to diskFalse - calculated datasets will not be written to disk
attribute_dict

The “attribute_dict” sheet is the source for the dict_attr.pkl file, which is a column name to column description dictionary used for plotting labels.
The values on this worksheet are not normally changed unless the user desires to change the description associated with an attribute. Changes here will be reflected in certain chart titles and labels.
ret_incr
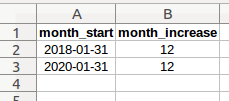
specify retirement age increase(s), by date and increase in months
month_start: month end date of month to begin retirement age increase (integer)
month_increase: increase in retirement age in months (integer)
If the user elects to include an increase in the data model retirement age, this worksheet will provide the program with the necessary inputs. The user simply adds a row for each planned age increase with the month end date to begin the new retirement age, along with the number of months to increase the age.
The program transforms the worksheet data into a tuple of tuples for program consumption. The example data above would be stored within the settings dictionary as follows:
{'ret_incr': (('2018-01-31', 12), ('2020-01-31', 12))}
pay_exceptions
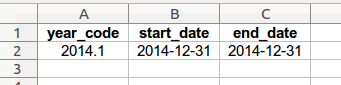
designate pay_exception periods with separate line entries
Pay rate change periods that do not occur on a calendar year basis are entered on this worksheet. There is no limit to the number of periods and the duration of any period may be set to any monthly time span. “year_code” entries in the first column must correspond to a rate schedule in the pay_tables.xlsx “rates” worksheet, under the “year” header. Additional pay exceptions may be designated simply by adding another row of information.
If the case study compensation data does not contain any pay exceptions, enter a zero (0) in column A beneath the “year_code” header (retain the pay_exceptions worksheet for proper program operation).
If the pay exception period is effective for only one month, enter that month in both the “start_date” and “end_date” columns, as shown in the example above.
The program will convert each row of worksheet information into a Python dictionary, using the “year_code” column as keys and a list of the “start_date” and “end_date” date values as values. The worksheet example above would be stored by the program as such:
{2014.1: [Timestamp('2014-12-31 00:00:00'),
          Timestamp('2014-12-31 00:00:00')]}
The pay exception information is used by seniority_list during the monthly compensation index construction process.
job_counts
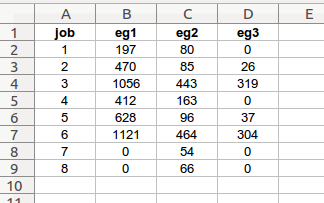
define the starting number of jobs in each level, by employee group
job: basic job level number codes (integer)
eg<n>: job counts in each basic job level category for each employee group (integer)
The “job_counts” worksheet provides an accounting of the number of basic jobs available within each job level for each employee group at the starting date of the data model.
Basic counts will be converted to enhanced counts automatically if the “enhanced_jobs” input (“scalars” worksheet) is set to “True”.
In the example above, three work group counts are indicated. The user should create one column of job counts for each employee group involved in the integration. Each column header containing counts must begin with the letters “eg” (employee group) and be in the order of the employee codes asssigned in master.xlsx, from left to right. The program looks specifically for job counts in columns which begin with “eg”. If this employee group does not have any jobs at a certain level, use a zero as a place-holder.
The job counts are stored in the settings dictionary as a list of lists:
{'eg_counts': [[197, 470, 1056, 412, 628, 1121, 0, 0],
                [80, 85, 443, 163, 96, 464, 54, 66],
                [0, 26, 319, 0, 37, 304, 0, 0]]}
This input is especially important to the central job assignment routine.
job_changes
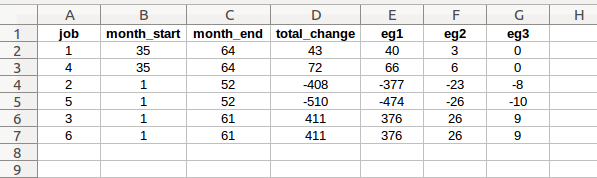
Increase or decrease the number of jobs at any job level, for any time period
job: job level affected (integer)
start_month: month in which job change begins (integer, counted from beginning of data model)
end_month: month in which job change ends (integer, counted from beginning of data model)
total_change: total change in job count (positive or negative integer)
eg<n>: job change counts in each employee group, total for the employee groups must equal the total change count. Employee count column headers must begin with “eg”, and be in ascending order from left to right. (integer)
This worksheet provides information to the program if the user elects to model a scenario where the number of jobs available in one or more job levels changes over time.
The job changes always refer to the basic job levels. If an enhanced model is selected, the job changes will be converted automatically to the proper number of enhanced jobs in each level.
Each job change event row will be programmatically converted to a list with the following format for use within seniority_list:
[job level affected, [start and end month], total change, [standalone allocation]]
Example (derived from first job change event row in screenshot):
[1, [35, 64], 43, [40, 3, 0]]The list above has been set to indicate a change in the number of jobs available at job level 1, starting in month 35 and ending at month 64, increasing 43 jobs, with separate employee group allocation set as 40 to group 1, 3 to group 2, and none to group 3. The program will use an algorithm to apply an even, incremental increase in jobs at level 1 over the number of months specified and will use the allocation schedule to apply the increase to the separate groups until the job changes occur after an implementation date.
Job changes may be an increase or decrease (positive or negative integer) and different job changes may occur at the same time.
Each job change list becomes an element within a list of all the job change events when processed by the program.
The number of “eg” columns, or employee group allocation columns, must match the actual number of employee groups. For example, if the case study only includes 2 employee groups, there would be no “eg3” column in the worksheet. Each column header containing job change counts for a specific employee group must begin with the letters “eg” and be in the order of the employee codes asssigned in master.xlsx, from left to right. The program looks specifically for employee group job change counts in columns which begin with “eg”.
recall
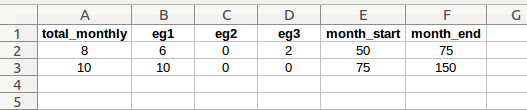
Recall schedule information for one or more recall periods
total_monthly: total monthly recall count (integer)
eg<n>: monthly recall counts for each employee group. The total for the employee groups must equal the total monthly recall count. Employee count column headers must begin with “eg”. (integer)
month_start: month in which recall begins (integer, counted from beginning of data model)
month_end: month in which recall ends (integer, counted from beginning of data model)
This worksheet provides information to the program if the user elects to model a scenario where furloughed employees are recalled over time.
Each recall event schedule (row) will be programmatically converted to a list with the following format for use within seniority_list:
[total monthly_recall_count, eg recall allocation, start_month, end_month]
Example (derived from first recall event row in screenshot):
[8, [6, 0, 2], 50, 75]The list above has been set to indicate a recall of 8 employees per month starting in month 50 and ending in month 75. The employee group allocation is 6 per month for employee group 1, and 2 per month for employee group 3. The separate group recall will apply until an implementation date. After an implementation date, the monthly recall amount will be applied to all furloughed employees, according to a recall priority function input. The default is to recall employees by rank within the proposed integrated seniority list (most senior first), but may be set to another method within the mark_for_recall function (functions module).
Each recall schedule list becomes an element within a list of all the recall events when processed by the program.
Recall schedules are ignored once all furloughees have returned to work. There may be more than one recall schedule and recall schedules may overlap.
The number of “eg” columns, or employee group allocation columns, must match the actual number of employee groups. For example, if the case study only includes 2 employee groups, there would be no “eg3” column in the worksheet. Each column header containing recall counts for a specific employee group must begin with the letters “eg” and be in the order of the employee codes asssigned in master.xlsx, from left to right. The program looks specifically for employee group monthly recall counts in columns which begin with “eg”.
prex

pre-existing job rights information, by employee group, basic job, allotment, and time frame
eg: employee group code (integer)
job: basic job level (integer)
count: job allocation count (integer)
month_start: month in which special job right begins (integer, counted from beginning of data model)
month_end: month in which special job right ends (integer, counted from beginning of data model)
This worksheet provides information to the program when modeling a scenario which contains special job guarantees to a subset of employees within one or more of the merging employee groups. These pre-existing job rights will be incorporated within both standalone and integrated models. This type of job right would likely be part of a previous seniority integration award or settlement.
The terms “prex” (pre-existing condition) and “sg” (special group) are used interchangeably.
The job rights always refer to the basic job levels. If an enhanced model is selected, the job rights will be converted automatically to the proper number of enhanced jobs in each level. See the “sg_dist” definition in the “scalars” worksheet discussion for guidance on controlling how the job rights are distributed between basic and enhanced job levels.
Each pre-existing job rights schedule (row) will be programmatically converted to a list with the following format for use within seniority_list:
[eg, jnum, count, start_month, end_month]
Example:
[1, 5, 43, 0, 67]The list above has been set to permit employees delineated as having special rights from employee group 1 to be assigned up to 43 positions in job level 5, starting with month 0 and continuing to month 67.
Employees with special job rights must be marked with a 1 in the input master.xlsx “sg” column. This marks employees within an employee group as those employees subject to special job assignment rights.
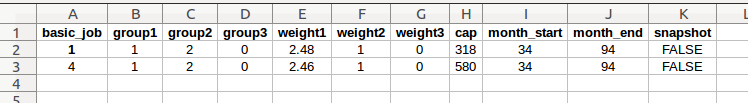
ratio_cond
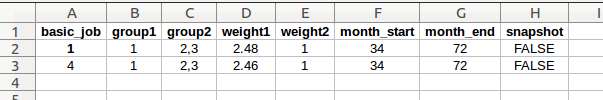
designate ratio condition employee groups, basic job(s) affected, ratio weightings, effective months, and snapshot option
basic_job: (integer) basic job level
group<n> columns: (integer or comma separated integers) for each “group” column, designate a ratio group by employee group code(s). If more than one employee group will make up the ratio group, enter both employee group codes, separated by a comma, such as “2,3”.
weight<n> columns: (integer or float) for each “weight” column, designate a value to be used as a ratio weighting. Any number value is valid. Weights will correspond to group codes and must be in same order as the group codes column-wise, from left to right.
month_start: (integer) model month in which to begin condition (from starting date, inclusive)
month_end: (integer) model month in which to begin condition (from starting date, inclusive)
snapshot: (boolean [“TRUE”, “FALSE”]) capture the existing job count ratio which exists at the “month_start” data model month (ignores the weight column inputs).
This worksheet provides information to the program if the user elects to model a scenario which contains a prospective job assignment condition based maintaining a ratio of jobs in a specified job level(s) between one employee group and one or more other employee group(s).
The basic_job column always refers to the basic job levels. If an enhanced model is selected, the job levels will be converted automatically to include enhanced jobs associated with the basic job levels or as otherwise directed by the convert function from the converter module. See the “ratio_dist” definition in the “scalars” worksheet discussion for guidance on controlling how the job levels are determined when using an enhanced job level model.
The user may add or delete “group” columns and “weight” columns as required for the case study, as long as this is done in corresponding pairs. The program will look for and match ratio groups (“group” columns) with ratio weightings (“weight” columns) by column order. Group and weight columns are identified by the program when column headers begin with “group” and “weight”. It is acceptable to have entires of zero (“0”) in a group column if necessary (with mergers involving more than two employee groups) to ignore that group column within a row entry, as in the following example:
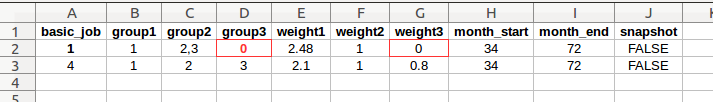
group 3 is not included in the basic job level 1 ratio condition and any weighting in the “weight3” column is ignored
A zero entry in a weight column corresponding to a valid non-zero group column will be interpreted by the conditional job assignment routine to mean that no new job openings should be assigned to that group(s). No bump, no flush rules will protect employees from the affected group from being displaced from current job levels. Positions available each month will be assigned to the appropriate group(s) so as to get as close as possible to the desired job ratio(s) over time.
The ratio_cond worksheet data is programmatically combined to form a dictionary for program operation. The dictionary is used as an argument for the assign_cond_ratio function. Jobs are assigned to the ratio groups according to the corresponding weightings beginning with the month_start and continuing until the ending date.
The function may be used in conjunction with the set_snapshot_weights function to capture an existing ratio of jobs between ratio groups as they exist at the “month_start” month snapshot. The snapshot weightings will be used during the condition period only (“month_start” to “month_end”). The snapshot option is selected by a “TRUE” cell input within the “snapshot” column.
The function will adjust the job assignment quota counts if the number of jobs available within job levels changes from month to month.
The dictionary is formed with the following format:
job level: [(employee groups), (weightings), start_month, end_month}]
Example (from first row of top example above, converted to enhanced job levels):
{1: [([1], [2, 3]), (2.48, 1.0), 34, 72],
 2: [([1], [2, 3]), (2.48, 1.0), 34, 72]}
The dictionary input above has been set to distribute job assignments for job levels 1 and 2 between employee group 1 and employee groups 2 and 3 (combined) at a ratio of 2.48:1, in data model months 34 through 72.
ratio_count_capped_cond
define count-ratio condition employee groups, basic job level(s), ratio weightings, cap(s), and effective months
basic_job: (integer) basic job level
group<n> columns: (integer or comma separated integers) for each “group” column, designate a ratio group by employee group code(s). If more than one employee group will make up the ratio group, enter both employee group codes, separated by a comma, such as “2,3”.
weight<n> columns: (integer or float) for each “weight” column, designate a value to be used as a ratio weighting. Any number value is valid. Weights will correspond to group codes and must be in same order as the group codes column-wise, from left to right.
cap: (integer) the maximum total number of jobs to distribute among the applicable employee groups
month_start: (integer) model month in which to begin condition (from starting date, inclusive)
month_end: (integer) model month in which to begin condition (from starting date, inclusive)
snapshot: (boolean [“TRUE”, “FALSE”]) capture the existing job count ratio which exists at the “month_start” data model month (ignores the weight column inputs). This ratio will be used for job assignments (up to the applicable job count cap).
This worksheet provides information to the program if the user elects to model a scenario which contains a prospective job assignment condition based on maintaining a ratio of jobs in a specified job level(s) count between designated employee groups. The condition is not applied to job assignments above the job count cap.
The job column always refers to the basic job levels. If an enhanced model is selected, the job levels will be converted automatically to include enhanced jobs associated with the basic job levels or as otherwise directed by the convert function from the converter module. See the “quota_dist” definition in the “scalars” worksheet discussion for guidance on controlling how the job levels are determined when using an enhanced job level model.
This data is used with the assign_cond_ratio_capped function, which assigns a limited pool of jobs from a selected job level between one group and another group according to a set ratio. There must be the same number of “weight” columns as “group” columns. Entries of “0” in “group” and “weight” columns are acceptable and will be ignored during calculations. The user may add or delete “group” columns and “weight” columns as required for the case study, as long as this is done in corresponding pairs. The program will look for and match ratio groups (“group” columns) with ratio weightings (“weight” columns) by column order. Group and weight columns are identified by the program when column headers begin with “group” and “weight”.
Alternatively, a minimum job count may be assigned to one employee group only, by listing the employee group in a “group” column, assigning a corresponding positive weighting (any other weightings should be zero), and assigning a “cap” as the minimum job allocation for the employee group.
As with the ratio condition above, the function may be used in conjunction with the set_snapshot_weights function to capture an existing ratio of jobs between ratio groups as they exist at the “month_start” month snapshot. The snapshot weightings will be used during the condition period only (“month_start” to “month_end”). The snapshot option is selected by a “TRUE” cell input within the “snapshot” column.
In the case where there are less jobs than the cap amount, the actual number of jobs available will be distributed according to the weightings.
The data is programmatically converted to a dictionary with the following format:
job level: [(employee groups), (weightings), cap, start_month, end_month]
Example (from first row of example above, converted to enhanced job levels):
{1: [([1], [2]), (2.48, 1.0), 191, 34, 94],
 2: [([1], [2]), (2.48, 1.0), 127, 34, 94]}
The dictionary input above has been set to distribute job assignments for job levels 1 and 2 between employee group 1 and employee groups 2 and 3 (combined) at a ratio of 2.48:1, in data model months 34 through 72. The conditional assignment will operate for up to the first 191 jobs in job level 1, and up to the first 127 jobs in job level 2.
proposal_dictionary
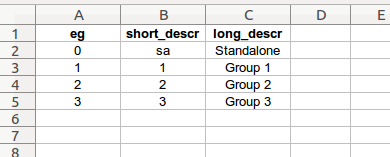
proposal number to description dictionary data
eg: employee group code, insert a zero to represent standalone data for plotting (integer)
short_descr: short descriptive labels for chart labels and titles
long_descr: longer descriptive labels for chart labels and titles
This worksheet provides information to the program which is used for some charting labels and titles relating to employee groups. It would be more correct to think of this worksheet as an employee group dictionary. Future coding work will change the name of this worksheet.
The data contained on this worksheet is transformed into two dictionaries. The “eg” column will be the integer keys in both, and the other columns will each make up the value items in separate dictionaries.
The “eg” column should contain the employee group codes in low to high sequential order, with the addition of a zero at the beginning to represent standalone data plotting.
The brief descriptions in the “short_descr” column will be the values in the “p_dict” dictionary:
{0: 'sa',
 1: '1',
 2: '2',
 3: '3'}
The slightly longer descriptions in the “long_descr” column will be the values in the “p_dict_verbose” dictionary:
{0: 'Standalone',
 1: 'Group 1',
 2: 'Group 2',
 3: 'Group 3'}
Both dictionaries are stored in the settings dictionary.
eg_colors
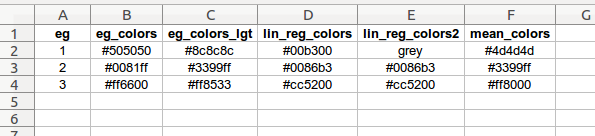
user-defined charting colors corresponding to the employee groups
eg: employee group codes, one row for each group (integer)
eg_colors: chart colors to use when plotting values representing the employee groups (color values)
eg_colors_lgt: alternate lighter chart colors to use when plotting values representing the employee groups (color values)
lin_reg_colors: sample set of colors which may be used with the editor tool when plotting polynomial regression lines (color values)
lin_reg_colors2: sample set of colors which may be used with the editor tool when plotting polynomial regression lines (color values)
mean_colors: sample set of colors which may be used with the editor tool when plotting average value lines (color values)
This worksheet provides lists of colors which are used to represent the employee groups or values associated with the employee groups when creating charts.
The lists are arranged vertically on the worksheet. The rows represent the employee groups and must be in employee group code sequential order, lowest to highest. The program will arrange each worksheet column into a dictionary with the color name (worksheet column header) as the key, and the color values in each column as the value (as a list).
Example (for the 3 employee group example in the image above, “eg_colors” column):
{'eg_colors': ['#505050', '#0081ff', '#ff6600']}The rest of the color lists would be treated similarly. The output dictionaries from this worksheet are added to the color dictionary file, dict_color.pkl.
basic_job_colors
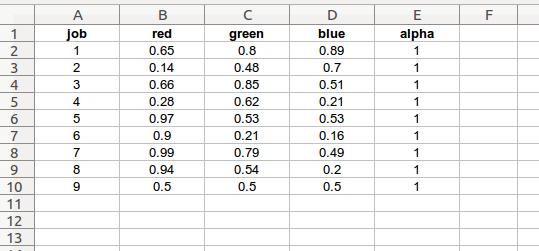
user-defined job level charting colors
job: basic job level (integer)
red: float value from 0.0 to 1.0
green: float value from 0.0 to 1.0
blue: float value from 0.0 to 1.0
alpha: float value from 0.0 to 1.0
This worksheet provides user-defined basic job colors in red, green, blue, alpha float format.
While the make_color_list plotting function provides many lists of colors for plotting, the user may wish to define specific color values to represent the various job levels within the data model.
List of color codes used by various plotting functions to represent job levels. The example color codes are in [red, green, blue, and alpha] float format, but color hex codes or color names may be used as well. The rgba color codes may be derived from the make_color_list plotting function, and then copied into the worksheet cells.
The length of these lists is: job level count + 1. The last color value will be used to represent furlough. The example below shows a color list for a case study with 8 basic job levels.
If the “scalars” worksheet “enhanced_jobs” input is False, the program will store the information on this worksheet in the color dictionary as a list of color lists:
{'job_colors': [[0.65, 0.8, 0.89, 1.0],
                [0.14, 0.48, 0.7, 1.0],
                [0.66, 0.85, 0.51, 1.0],
                [0.28, 0.62, 0.21, 1.0],
                [0.97, 0.53, 0.53, 1.0],
                [0.9, 0.21, 0.16, 1.0],
                [0.99, 0.79, 0.49, 1.0],
                [0.94, 0.54, 0.2, 1.0],
                [0.5, 0.5, 0.5, 1.0]]}
enhanced_job_colors
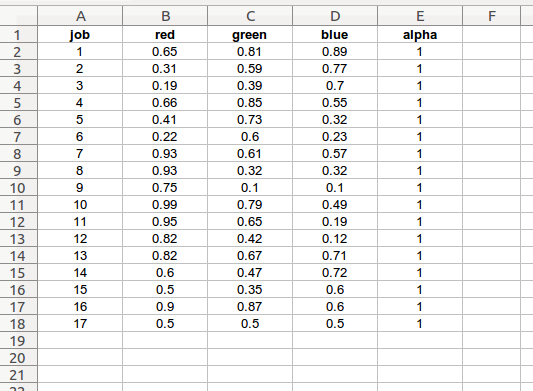
user-defined job level charting colors
job: enhanced job level (integer)
red: float value from 0.0 to 1.0
green: float value from 0.0 to 1.0
blue: float value from 0.0 to 1.0
alpha: float value from 0.0 to 1.0
The description for this worksheet is almost identical to the “basic_job_colors” guide above. However, there will normally be twice as many job colors (one for each enhanced job level) plus a furlough color value.
If the “scalars” worksheet “enhanced_jobs” input is True, the program will store the information on this worksheet in the color dictionary as a list of color lists:
{'job_colors': [[0.65, 0.81, 0.89, 1.0],
                [0.31, 0.59, 0.77, 1.0],
                [0.19, 0.39, 0.7, 1.0],
                [0.66, 0.85, 0.55, 1.0],
                [0.41, 0.73, 0.32, 1.0],
                [0.22, 0.6, 0.23, 1.0],
                [0.93, 0.61, 0.57, 1.0],
                [0.93, 0.32, 0.32, 1.0],
                [0.75, 0.1, 0.1, 1.0],
                [0.99, 0.79, 0.49, 1.0],
                [0.95, 0.65, 0.19, 1.0],
                [0.82, 0.42, 0.12, 1.0],
                [0.82, 0.67, 0.71, 1.0],
                [0.6, 0.47, 0.72, 1.0],
                [0.5, 0.35, 0.6, 1.0],
                [0.9, 0.87, 0.6, 1.0],
                [0.5, 0.5, 0.5, 1.0]]}
anonymizing input data
seniority_list includes several functions which are able to modify worksheet data within the excel input files, with focus on the master.xlsx and pay_tables.xlsx files. These operations are helpful when the user wishes to publicly share data or analysis which could otherwise be considered confidential. For example, these functions can quickly produce substitute names and employee numbers for all employees. Subsequent datasets and chart analysis will reference the modified input data.
Please see the “program demonstration” section within the user guide for more information.