operational overview
abstract
The program models employee future career progression, reflecting standalone and integrated list proposals, and stores this information in files known as datasets. The datasets are analyzed and compared across a broad range of attributes. This process provides objective, outcome-based analytics for integration decision-makers.

high-level dataset production diagram (click to enlarge)
basics
The seniority_list program generates a data model built upon predictable variables while isolating inputs that cannot be directly quantified.
In other words, certain aspects or parameters are known and unlikely to change, while others are likely or sure to change. The factors that are known or predictable are incorporated within the model calculations. The unpredictable factors are handled equally (controlled) for each group so that their influence upon accuracy of the model is minimized or eliminated.
Examples of predictable variables include job counts, retirement counts, and pay scales. Unpredictable variables include individual bidding choices and future employee work leaves.
With the effect of the unpredictable variables removed, the results of the calculations will be directly related to the predictable variable inputs. List order is the primary predictable variable and has by far the most influence on the resultant datasets.
By default, seniority_list constructs the job level hierarchy in accordance with compensation scales and assumes that all employees will continuously bid for the highest paying job. Consequently, the resultant employee career metrics produced by the program reflect and focus primarily on the true effect of the ordering of proposed integrated lists. However, the data model job level hierarchy (used by the program job assignment routines) may be set by the user to match the requirements of specific case studies when necessary.
quick outline of seniority_list
The information below will cover the basics of seniority_list - an overview of how the program works and what it does.
The “user guide” section of the documentation will provide much more detailed discussion and instruction after basic program concepts are introduced here.
gather and prepare data
Before seniority_list can begin, it must be able to read specifically formatted input from within designated project folders. Therefore, the first step for the user is to aquire the required data and to format and store it properly.
seniority_list is designed to read all user input data directly from Excel spreadsheets. This information includes general employee lists, compensation data, proposed integrated lists, job assignment schedules, and many other miscellaneous user-specified options.
During the initial phase of data preparation, any differences between input lists must be resolved, such as the number and status of employees or the number of jobs available in each category. The list_builder module contains functions useful for rapidly finding differences between spreadsheets.
Excel workbook data sources
seniority_list uses four Excel workbooks as source data when creating the foundational program files. Detailed guidance concerning the content and formatting requirements of the input workbooks is presented in the “excel input files” section of the documentation.
Each case study will require the following four workbooks to be placed within a case-specific folder located within the program’s “excel” folder.
- master.xlsx
This is the workbook which contains general employee data. This single-worksheet workbook contains approximately 10 columns of data for every employee.
- pay_tables.xlsx
The compensation information will likely require the most formatting in terms of the worksheet layout and data preparation. Specific worksheet naming and formatting is required for two worksheets, one containing hourly pay rates for each job level/longevity combination, and another listing the total monthly pay hours for each job category.
- proposals.xlsx
List order proposals are stored in the third workbook with a separate worksheet for each ordering proposal. These worksheets contain only two columns: order number and employee number (empkey).
- settings.xlsx
This workbook stores data related to program options and schedules. It also contains some plotting function values concerning labels and colors for output charts.
other list order sources
List proposals submitted by parties are normally stored and read from the Excel proposals.xlsx input file.
There are two other ways to prepare and provide list order input to the program:
New list ordering may be generated by utilizing the functions within the list_builder script.
Modifications to any list ordering may be accomplished by utilizing the interactive list editor tool.
build the basic program files from the input data
seniority_list begins by creating certain files needed by the program for dataset generation and other operations.
As mentioned above, seniority_list is able to directly read and write Excel files. However, it is magnitudes faster to use a different format optimized for Python when retrieving and storing data for internal program operation. Therefore, each input Excel file is read once, converted to a pandas dataframe, and then stored as a serialized “pickle” file for further use within seniority_list.
seniority_list also modifies the structural format of the input files as necessary during the conversion process. The format modification allows for fast and efficient data indexing and access during program operation. For example, the compensation data will be converted from a wide-form, spreadsheet-style table to an indexed long-form format, while the master list file will be stored in a nearly identical row and column format as the original.
A few helper program files derived from the input files are calculated and stored during this process as well.
create the “skeleton”
Note
pandas (with a small “p”) is a powerful Python library (add-on program) used for data analysis work. pandas, along with a number of other specialized Python libraries, is used extensively within the seniority_list code base. The primary data structure provided by the pandas library is the dataframe. The dataframe can be described as an in-memory tabular structure similar to a spreadsheet, but far more capable and powerful, especially when combined with other Python tools.
A dataset is the calculated data model resulting from a particular integrated list ordering proposal and its associated conditions. The skeleton provides the starting point or frame for the creation of a complete dataset. Each case has one unique skeleton, just as each case has its own set of employees and lists.
The skeleton is a “long-form” pandas dataframe containing calculated data derived from the basic “short-form” master list data.
“Short-form” refers to a dataset containing static list data, without any future progression calculations. It’s length is equal to the number of employees.
“Long-form” refers to a dataset that contains information for every month for each employee remaining on the list (not retired) for that month.
The skeleton contains many columns of data, most of which is general employee data relating to specific employees and months. All of the pre-calculated information contained within the skeleton is independent of and unaffected by changes in list order. The data includes such things as hire date, month number, employee group number, age, and retirement date.
The skeleton forms the foundation or starting point for the production of all datasets pertaining to a particular case. The number of rows in the skeleton and in the final dataset is the same, but many additional columns of calculated data will be added to the skeleton as a dataset is formed. Because each particular proposal orders the integrated list differently, prior to each proposal dataset generation, the skeleton is first reordered to match the order of the appropriate proposal (model) list order before any calculations begin.
The case-specific skeleton provides a common source of pre-calculated, order-independent data which serves as a starting point for each large dataset generation process. The skeleton must only be sorted to match a specific proposal ordering each time a dataset is generated.
calculate standalone dataset
“Standalone” refers to an unmerged, or independent employee group, and normally relates to modeling each employee group separately as if no merger had occurred.
The skeleton file contains information for all of the employee groups.
Information pertaining to each separate group may be extracted from the skeleton file quite easily and processed independently. Because list order within each native group is static, it is a fairly straightforward task to compute the standalone datasets as compared to an integrated dataset computation.
Though the job assignment process is less demanding with separate groups, there are other conditions which complicate matters. If there are any pre-existing special rights to jobs within one or more of the employee groups, they must be honored and applied. Additionally, the number of jobs within each job level will likely fluctuate over time. This directly affects job assignment. Finally, furloughs and recalls must be handled properly according to job count changes and recall schedules.
The standalone dataset is created as a pandas dataframe and is stored in a serialized pickle file format.
calculate integrated order-dependent dataset
The production of an integrated dataset is more complex than the standalone datasets.
The integrated datasets are list order dependent. As mentioned above, before any work can begin, an appropriate list order must be selected and the skeleton file sorted accordingly. A properly sorted skeleton file serves as the framework for an integrated dataset.
An integrated list typically introduces multiplex requirements into the dataset calculation process.
A standard provision when integrating a workforce is that an employee will be able to keep a job held prior to a merger, even if the integrated list places that employee in a position that would not permit it. This provision is known as “no bump, no flush”.
Quite often, due to differences in demographics, hiring patterns, and job opportunities, “fences”, or conditions and restrictions are applied prospectively to the operation of a combined seniority list. These fences may place a cap or floor on the number of jobs which may be held by employees from one or more of the original groups, provide some sort of ratio assignment process, or apply some other corrective action to ensure an equitable outcome.
It is also common to see a time span between the “official” merger date and the actual implementation of an integrated seniority list. This delayed implementation affects the future operation of the list.
seniority_list is able to incorporate all of these factors along with pre-existing job assignment conditions, job count changes, furlough and recall schedules, and compensation schedules when calculating integrated datasets.
As with the standalone dataset, the integrated dataset(s) will be pandas dataframes, written to disk as serialized pickle files.
The integrated datasets contain one row for each employee for every month within the model. This means that the datasets may be fairly large. While the exact size depends on the demographics of the employees, an initial list with 12,000 employees will typically produce a dataset with over 1.5 million rows containing 34 columns of data. For reference, as of version 0.62, the time required to produce one dataset of that size and write it to disc is under 3 seconds with a linux desktop computer equiped with a relatively fast processor (i7) and a solid state drive. Processing time will be more or less depending on the computer hardware and operating system utilized when running the program.
analyze results
Once the datasets have been produced, the user is free to explore them using many of the built-in methods of Python and the “scientific stack” libraries including pandas, NumPy, SciPy, and others. The datasets are stored as files which may be converted to other types of files for analysis within other programs. Interactive exploration and visualization of the dataset is readily available through the use of the Jupyter notebook or an Ipython session. The Jupyter notebook is the recommended interface to seniority_list for all users due to its excellent interactive features.
seniority_list includes many built-in plotting functions making it relatively simple to visually explore and contrast multiple attributes of the datasets. Most of these functions accept a variety of inputs allowing a wide range of analysis. The included STATIC_PLOTTING.ipynb and INTERACTIVE_PLOTTING.ipynb notebooks demonstrate many of these functions.
The standard built-in charts are produced by a Python library called matplotlib, and another called seaborn, which is a charting library built on top of matplotlib with a focus on statistics. Interactive charts and the editor tool are powered by the bokeh library which provides users with real-time selection, filtering, and animation of the dataset results.
seniority_list also includes a reports module with functions that produce summarized statistical data from all calculated datasets for the current case study. The generated data is presented in tabular form via excel spreadsheets and/or visually through numerous chart images. The summary reports offer a high-level view into integrated list outcomes across a limited set of attributes for quick familiarization and comparison of proposal outcomes. The REPORTS.ipynb notebook included with the program provides an example of the report generation process.
modify list order with the editor tool (optional)
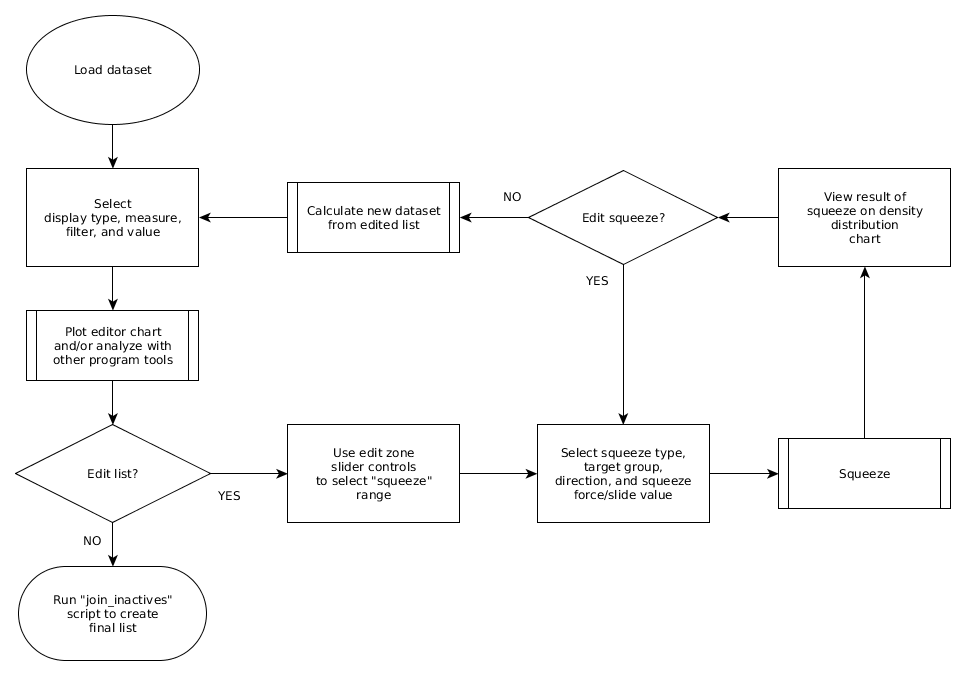
list editing process (click to enlarge)
Initial dataset analysis will likely reveal certain issues of inequity related to a particular list order proposal. The editor tool was designed to allow adjustment of proposed list order through an interactive process.
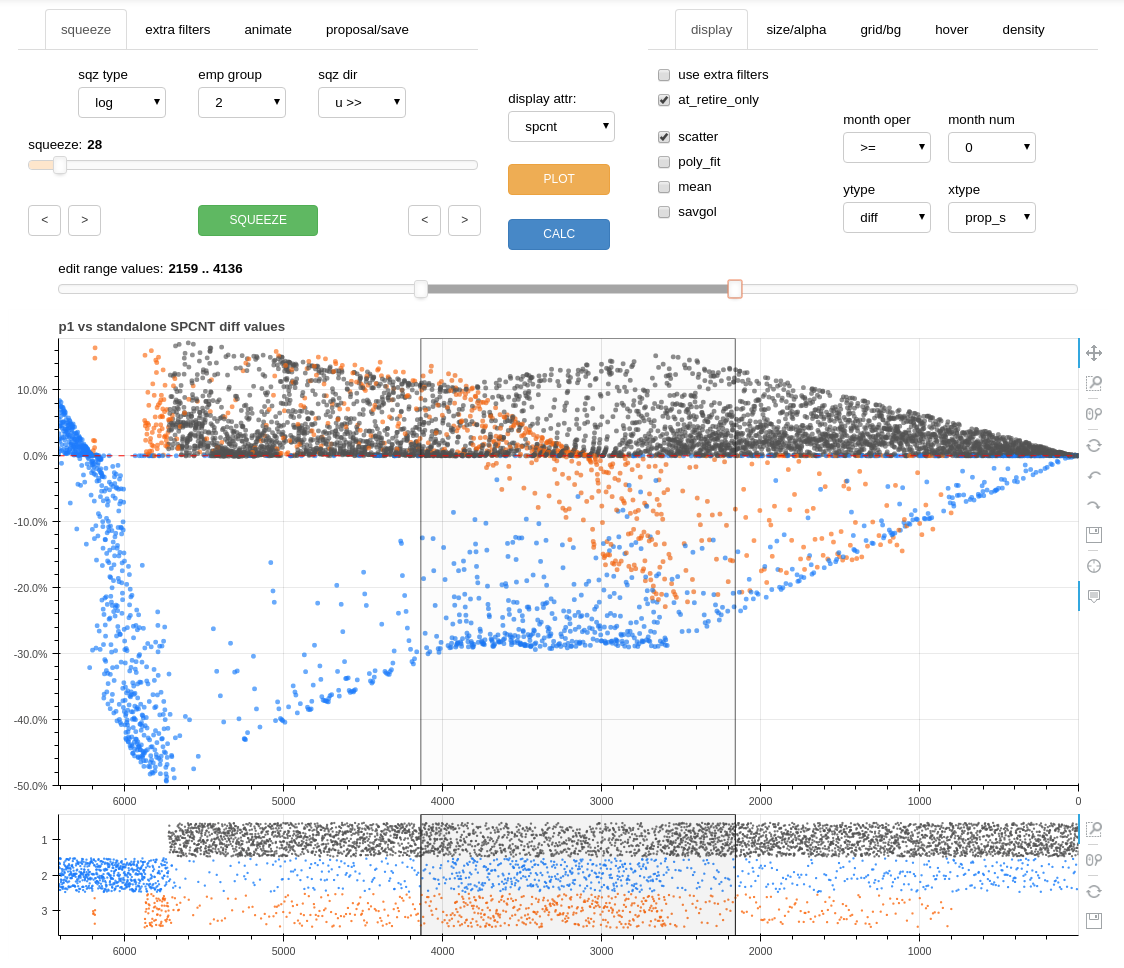
the editor tool interface
An attribute differential comparison or actual values chart is used to quickly reveal equity distortions within an integrated dataset and to identify where modification of list order may be necessary to minimize excessive gains or losses for a specific employee group(s) or to more evenly distribute opportunities within the combined workforce.
A section of an integrated list may be edited by using slider controls within the editor tool to position vertical lines on either side of the section. An algorithm within the editor tool is then utilized to “slide” or “squeeze” the members from one of the original employee groups up or down the list, creating a new modified order, while maintaining proper relative ordering within each employee group. The movement of an employee group relative to another employee group(s) within an integrated seniority list not only changes the relative ranking of employee groups to one another but also effectively changes the distribution of jobs over the life of the data model, which in turn affects other outcome dataset metrics.
The relative positioning of each employee group may be precisely adjusted with the editor tool so that calculated attribute differentials (gains or losses) are minimized, or observed inequitable attribute outcomes are reduced or eliminated.
The edit process may be repeated and adjusted as necessary to selected sections of integrated list until the equity distortion(s) are reduced or eliminated.
create lists with list_builder (optional)
The list_builder module contains functions allowing custom list construction from the master file input. “Hybrid” lists may be built by ranking and sorting the master list according to a combined weighted attribute product. Any combination of attributes and weightings may be incorporated to contruct lists.
Note
“Hybrid” lists must only be considered as a starting point in nearly all cases. This is due to the simple fact that a consistent formula applied to combine lists with inconsistent attributes, such as demographics and hiring patterns, will invariably lead to inequitable outcome results. An unmodified hybrid style list solution would be acceptable only in the rare case when employee groups are nearly identical in terms of attribute distribution.
reinsert inactives
Inactive employees are defined as employees who are not occupying or bidding for a position which would otherwise affect the job opportunities for those employees below him/her on the seniority list. Examples of inactive employees may include those with a status of medical, military, or supervisory leave.
Because inactive employees do not bid for jobs and have no effect on the operation of a seniority list, they are removed from the list prior to the dataset calculation process. While many on inactive status will return to active status, the assumption is made that other employees will do the opposite and provide a counterbalance.
Once a final integrated list order has been determined, the inactive employees must be reinserted into the overall list.
The inactive employees are reinserted using the join_inactives script. The inactives may be inserted into the integrated list by locating them next to an employee from their native group who is either just senior or just junior to them. The final product of this process is converted to an Excel spreadsheet, placed within the reports folder.
interacting with seniority_list
seniority_list was designed to use the browser-based Jupyter notebook as its interface in all areas of functionality. The Jupyter notebook has a relatively shallow learning curve while yielding vast returns.
seniority_list has been tested using FireFox and Chrome (or Chromium) browsers. Chrome offers better performance when using seniority_list and is recommended. FireFox will work with the program, but will lag somewhat when displaying complex visualizations. Other browsers have not been tested.
There are five notebook files included with seniority_list to help the user get started. Please refer to the user guide for more information.